The very centers of urban cores in many major metropolitan areas are experiencing a resurgence of residential development, including new construction in volumes not seen for decades. There is a general impression, put forward by retro–urbanists (Note 1) and various press outlets that the urban core resurgence reflects a change in the living preferences of younger people – today’s Millennials – who they claim are rejecting the suburban and exurban residential choices of their parents and grandparents.
![]() There is no question that the millennial population has risen in urban cores in recent years. Yet the growth in the younger population in urban cores masks far larger increases in the same population group in other parts of major metropolitan areas and in the nation in general.
There is no question that the millennial population has risen in urban cores in recent years. Yet the growth in the younger population in urban cores masks far larger increases in the same population group in other parts of major metropolitan areas and in the nation in general.
Functional Analysis of Metropolitan Areas
This article continues a series examining the 52 major metropolitan areas (those with more than 1,000,000 residents) using the City Sector Model, which allows a more representative functional analysis of urban core, suburban, and exurban areas, by using smaller areas, rather than using municipal boundaries. The City Sector Model thus eliminates the over-statement of urban core data that occurs in conventional analyses, which rely on historical core municipalities, most of which encompass considerable suburbanization.
The City Sector Model classifies 9,000 major metropolitan area zip code tabulation areas using urban form, density, and travel behavior characteristics. There are four functional classifications: the urban core, earlier suburban areas, later suburban areas, and exurban areas. The urban cores have higher densities, older housing and substantially greater reliance on transit, similar to the urban cores that preceded the great automobile oriented post-World War Two suburbanization. Exurban areas are beyond the built up urban areas. The suburban areas constitute the balance of the major metropolitan areas. Earlier suburbs include areas with a median house construction date before 1980. Later suburban areas have later median house construction dates (Note 2).
20-29s and the Urban Core
The age band best approximating millennials for the period of 2000 to 2010 is people of from 20 to 29 years of age.
Between 2000 and 2010, the total population of 20-29’s living in the functional urban cores increased by 300,000, from 4.3 million to 4.6 million from 2000 to 2010. Yet, the share of 20-29s living in the urban cores actually declined over the decade.
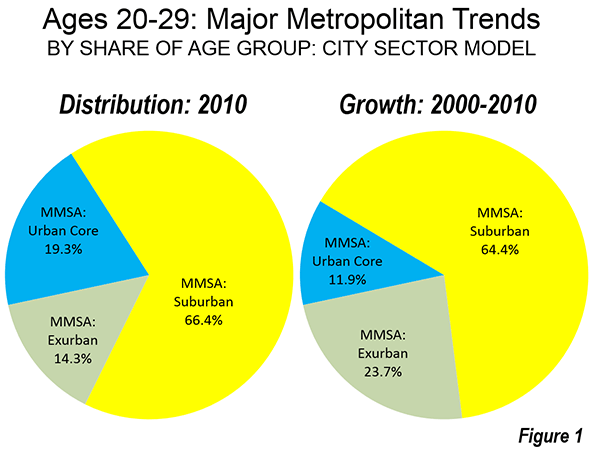
In 2000, 20.2 percent of the major metropolitan area 20- to 29-year-old population was in the urban core. By 2010, it had dropped to 19.3 percent, a 4.4 percent share reduction. This happened because the 300,000 increase in 20-29s in the urban core was dwarfed by the overall 2.6 million increase in the same age group throughout the major metropolitan areas. As a result, only 12 percent of the 20-29 population growth was in the urban core, 40 percent below its 2000 share.
While 80 percent of the 20-29s lived outside the urban cores in 2000, 88 percent of the 20-29 population growth was outside the urban core between 2000 and 2010 (Figure 1). Overall, the suburban and exurban millennial population grew nearly 8 times than in the urban core.
The 20-29s and the Balance of Major Metropolitan Areas
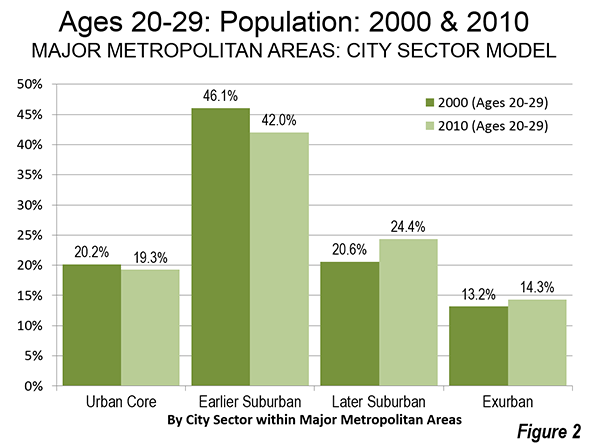
The trend among the 20-29s also tended away from the areas adjacent to the urban cores. These tend to be earlier suburban areas (generally with median house construction dates before 1980). Between 2000 and 2010, the share of 20-29s living in the earlier suburbs fell from 46.1 percent to 42.0 percent. This was double the urban core loss noted above (4.4 percent), at 8.9 percent.
At the same time, millennials, long said to hate suburbs, have embraced dispersion. The more recently built suburban areas saw their share of 20-29s rise from 20.6 percent to 24.4, an 18 percent gain. A smaller gain was registered in exurban areas, where the share of 20-29s rose from 13.2 percent to 14.3 percent; an 8 percent share gains (Figure 2).
The net effect from 2000 and 2010: a full five percent more of all 20-29s in major metropolitan areas lived in the later suburban and exurban areas, while 5 percent fewer lived in the urban cores and earlier suburbs. The later suburbs and exurbs added 1,500,000 more 20-29s than the urban core and earlier suburbs.
Millennials and the Nation
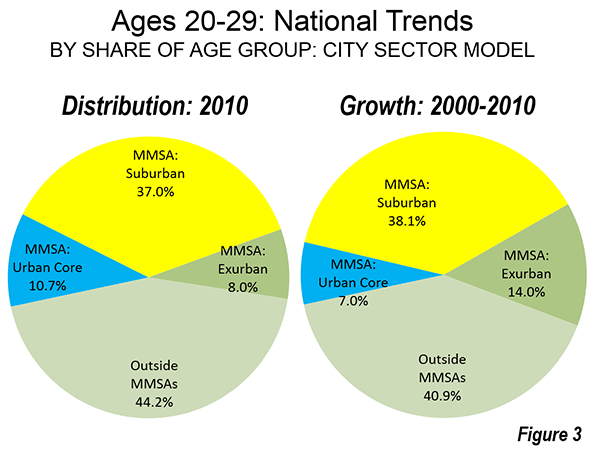
The numbers of 20-29s continued to increase in the rest of the nation’s small towns and cities, as well as rural areas. In 2000, approximately 44.6 percent of the 20-29 population lived outside the major metropolitan areas. In the next decade, these areas added 20-29s at a lower rate (40.9 percent of the increase), yet this was enough to keep the share of 20-29s at 44.2 percent. In 2010, more than four times as many 20-29s lived outside the major metropolitan areas as lived in the urban cores. Between 2000 and 2010, the growth in 20-29’s living outside the major metropolitan areas was almost six times the growth in the urban cores (Figure 3).
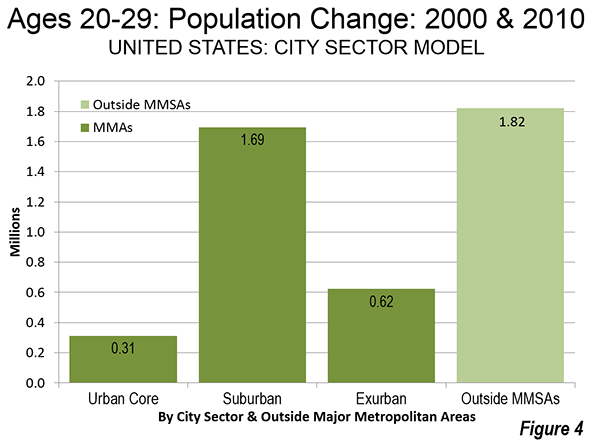
Overall, only 7 percent of the growth in the 20-29 age group was in the functional urban cores between 2000 and 2010. That left 93 percent of the growth to be outside the urban core (Figure 4).
Consistency with Other Research
The trend among the 20-29s in the urban core may seem surprising. However, it is consistent with an analysis of 2000-2010 data by the US Census Bureau, which indicated that the population gains within two miles of the city halls of the largest cities were more than offset by losses in the ring between two and five miles from City Hall. While the gains in the course of the urban cores are impressive, they are much smaller when considered in the context of the entire urban core and even smaller in the context of the entire metropolitan area.
More recent data suggests the dispersion of Millennials is continuing. According to Jed Kolko, Chief Economist at Trulia.com Millennials located in larger numbers in suburban areas than in the urban cores between 2012 and 2013 (more recent data for the city sector analysis is not yet available)
Dispersing, But Not Quite as Quickly
Essentially what we see here is myopic prejudices of contemporary journalism. More than 300,000 new 20-29 residents in the urban cores was more than enough to be noticed by analysts and reporters, since that’s where many of them spend much of their time. Moreover, the share of 20-29s living in urban cores dropped less than one-half the rate for all ages in the urban core.
Simply put, despite the conventional wisdom, 20-29s are not abandoning the suburbs and exurbs for the urban core. The data indicates that the 20-29s have been more inclined to choose the urban core than other age groups, but not enough to prevent their overwhelming numbers living in suburban and exurban communities. Nor has this inclination been sufficient to counter the continuing relative decline in the urban core among the 20-29s.
Wendell Cox is principal of Demographia, an international public policy and demographics firm and senior fellow in urban studies at the Independence Institute, a free market think tank in Denver. He is co-author of the “Demographia International Housing Affordability Survey” and author of “Demographia World Urban Areas” and “War on the Dream: How Anti-Sprawl Policy Threatens the Quality of Life.” This article originally appeared at NewGeography.com
Note 1: The term retro-urbanist is applied to the currently popular strain of urban planning that favors urban cores over the rest of the urban area and metropolitan area (the suburbs and exurbs).
Note 2: The previous articles in this series are:
From Jurisdictional to Functional Analyses of Urban Cores & Suburbs
The Long Term: Metro American Goes from 82 percent to 86 percent Suburban Since 1990
New York, Legacy Cities Dominate Transit Urban Core Gains
Functional v. Jurisdictional Analysis of Metropolitan Areas
City Sector Model Small Area Criteria


