Another year, some more ridership numbers, and more evidence that the metro Denver area’s public transportation continues to deliver less value for more money. The 8-county* Regional Transportation District (RTD) continues to report declining ridership, and increasing operating costs.
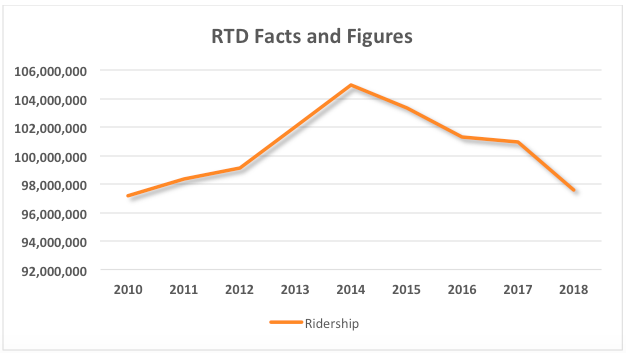
According to the Facts and Figures page on RTD’s website, total ridership fell for the fourth straight year in 2018, to 97.6 million. This is down from 100.9 million total boardings in 2017, and off 7% from 2014’s high of 104.9 million. It is only slightly higher than 2010’s ridership of 97.2 million.
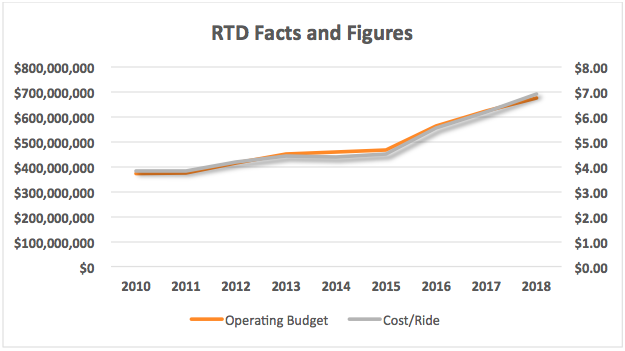
Additionally, Denver area residents are paying more and more for fewer and fewer rides. Not only does RTD have the highest one-way fares of any major city in the country, the system’s operating budget has ballooned by 46% since 2014 and 81% since 2010. As a result, the operating cost per ride is up nearly 60% in four years.
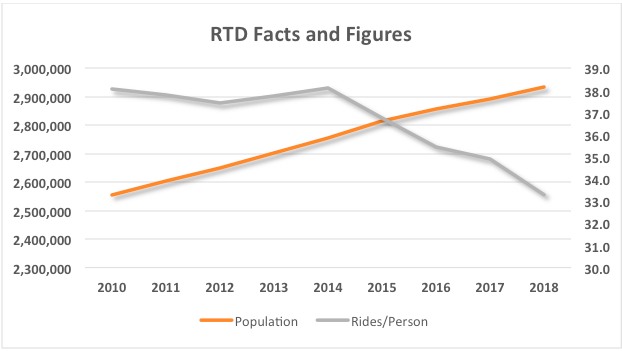
The decline comes even as the Denver-Aurora-Lakewood area’s population has risen dramatically, up an estimated 6% since 2014, and nearly 15% since 2010. So even as more and more people move to the Denver area, fewer and fewer are choosing to commute via public transportation. Understand that these numbers include the 16th Street Mall Shuttle, where the vast majority of boardings don’t really qualify as transit.
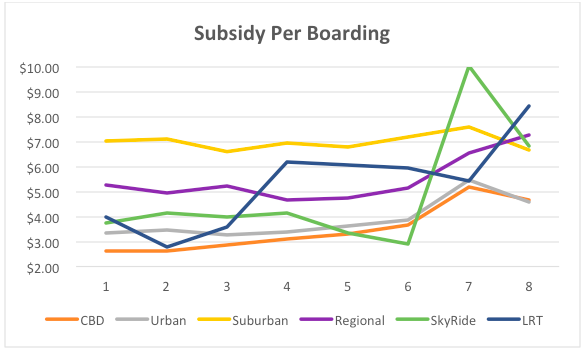
Overall, taxpayer subsidies per boarding have risen substantially from 2010 to 2017, with only the suburban routes holding steady. The sudden jump in SkyRide subsidies was a result of riders shifting to the Airport rail lines; hours in service for SkyRide buses are down nearly half since 2015. The reported subsidy is that portion of the operating cost not covered by the fare the rider pays. RTD’s budget is covered by a 1% sales tax surcharge on its 8-county operating area.
In addition to the Facts and Figures, RTD produces at least two other ridership reports, a performance report showing all riders on each bus and rail route, and a breakdown of Monday-Thursday boardings at each light rail station. They tend to run somewhat behind the system-wide totals; the 2017 performance report was only available in February of 2019.
Those reports aren’t any more encouraging. Base rail ridership grew in 2016 and 2017 as the system added lines, but was flat in 2018, growing by less than one-half of one percent. What’s more, the ridership on the Aurora and US-6 West lines was so far below expectations that RTD has considered cutting back service. That might be a good idea, since the per-ride subsidy on the Aurora-centric R line was listed as an eye-popping $20 per ride.
*RTD’s eight counties are Adams, Arapahoe, Boulder, Broomfield, Denver, Douglas, Jefferson, and Larimer Counties.
Joshua Sharf is a fiscal policy analyst at the Independence Institute, a free market think tank in Denver.