If it comes out on a Friday, it must be bad news, and Colorado’s Pubic Employees’ Retirement Association (PERA) released its Consolidated Annual Financial Report (CAFR) and Actuarial Valuation last Friday. The fund lost 3.5% on its investments in 2018, largely fueled by a year-end drop in stocks. This was the fourth losing year since 2000, and PERA was reduced to noting with grim satisfaction that its benchmarks had  performed at -3.6% for the year.
The loss had the effect of decreasing the Net Position by $1.8 billion. PERA counts on those returns to boost its funded level. Pera paid out $2.2 billion more in benefits than it took in from contributions. That imbalance, combined with the investment loss, further dropped the Net Position from roughly $53 billion to $49 billion, or about 7.5%. The overall funded ratio for the pension trust funds fell from 65% to 57.8% using the market value of assets.
Here’s where the effects of the ratchets implemented last year in Senate Bill 18-200 come into play. The plan was to have at worst a 30-year march to full funding, called the amortization period. It is measured using a so-called “closed amortization,” meaning that for each year, the time to funding should decline by a year. This is compared to an “open amortization” where the time to full funding stays at 30 years, retreating before policymakers and fund managers like a father backing up as he teaches his kid to swim.
When PERA fell behind that schedule, four adjustments would take place: 1) Retirees’ Cost of Living Adjustments (COLAs) would decrease; 2) Members’ contributions would increase; 3) Taxpayers’ contributions through the employers would increase; 4) Taxpayers’ contributions through a line item in the state budget would increase. In addition, members and employers see an immediate increase in their baseline contributions. All of these take effect starting in 2020.
The effect on amortization periods is dramatic. This chart from PERA’s 2017 CAFR shows the 2017 periods, the 2018 periods not counting the ratchets, and the 2018 periods after accounting for the benefit and contribution adjustments:
| Amortization Period (years) | |||
| Trust Fund | 2017 Valuation | 2018 Valuation | 2018 After Adjustments |
| State | 27 | 33 | 28 |
| School | 30 | 41 | 34 |
| Local Government | 15 | 40 | 29 |
| Judicial | 15 | 24 | 21 |
| DPS | 17 | 20 | 17 |
Without the ratchets, the amortization periods for the two biggest funds, the State and School Divisions, plus the Local Government Division, would already have blown past the 30-year benchmark. As it is, even with the adjustments, the School Division is still over it, and the State and Local Government funds are flirting with it. (The Local Government’s position is damaged by a legislative decision to eliminate the 2 percent member contribution increase.)
The good news is that PERA isn’t right back where we started after a bad investment year. The bad news is that the ratchets have limits, so there are only so many bullets there to be fired. Two or three more years of flat returns could put us in a worse bind than before.
![]() And the other bad news is that much of this stabilization is being paid for by existing retirees, who have already made their investment and retirement decisions. They have the further bad luck of living in a state where rents are rising, and the same state legislature is considering raising their property taxes by eliminating the Senior Homestead Exemption. Unfortunately, the courts haven’t left much else on the table for adjustment.
And the other bad news is that much of this stabilization is being paid for by existing retirees, who have already made their investment and retirement decisions. They have the further bad luck of living in a state where rents are rising, and the same state legislature is considering raising their property taxes by eliminating the Senior Homestead Exemption. Unfortunately, the courts haven’t left much else on the table for adjustment.
All of this also assumes a long-term 7.25% rate of return. Recent market-based studies by the Pew Foundation suggests that a 6.4% rate is more realistic. If Pew is right, and PERA is wrong, those State and School Division funding ratios drop into the low-50s, beginning to approach those of public pension basket-case states such as Illinois.
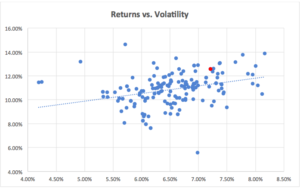
Of as much concern as the actual rate of return is the volatility of that return. Bad years hurt more than good years help, so keeping volatility down is important. Unfortunately, PERA has a history of higher-than-average volatility, even accounting for the more aggressive investment portfolio they have in order to chase those needed returns.

To the right is a chart of the 170 public plans in Boston College’s Center for Retirement Research that have returns for all years from 2001-2017.
I’ve included those that have reported for 2018. Left to right is the average return for those years, vertical axis is the standard deviation of those returns (which we’ll call volatility). PERA is the red dot. This means that PERA is taking on more risk for its return, compared to other public pensions.
In addition, a fair number of these pension funds report quarterly returns, although these are obviously unaudited and not complete financial statements. PERA only reports annually, and well after the legislative session has ended. Even with a February alert that 2018’s returns would be uninspiring, the final number came as a surprise. Quarterly reports would provide more timely information, making legislative oversight easier, and quite likely without much additional work on PERA’s part.
Joshua Sharf is a fiscal policy analyst at the Independence Institute, a free market think tank in Denver.


